New mobility solutions raise questions
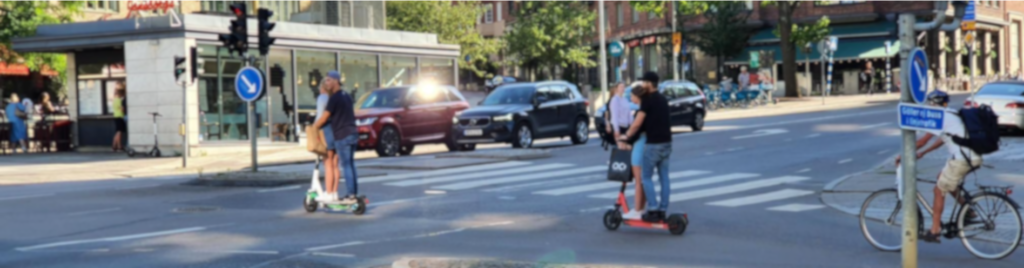
E-scooters are ubiquitous in most cities and have become part of our daily life. There are a number of competing providers and platforms, such as Bolt, Voi, Tier, Lime – they come at scale, and they are here to stay. Mobility platforms such as these enable us to move efficiently within the city and offers great flexibility, but they also pose new challenges and raise questions:
- Concerns about safety and security for drivers and pedestrians?
- Impact on traffic planning as mobility patterns change?
- Where are e-scooters allowed, and where not?
From a data scientist’s perspective, however, we have also gained a network of smart city sensors, allowing us to gather insights on behaviour and movement patterns. What could these sensing devices be used for, what can we learn, and what is the impact?
Exploring data and visualizing patterns
As advisory data scientists, we are regularly faced with challenging data problems where our clients need expert support to tackle a business challenge. Open data from electric kick-bikes make up an excellent field for demonstrating methods and tools for processing IoT data, extracting deeper insights and utilizing information to improve society. It is also an excellent topic for visualization of data – “seeing is believing” – an image can often open our minds in a way that pure data and statistics cannot. In this case, we work with geographical positions of the kick bikes over time, apply geospatial analysis and data science methods to arrive at digested insights and possible actions. Typically, this involves millions of updates from the kick bikes over time, but as we know from big data, size does not matter, value does.
“Seeing is believing” – visualizing patterns helps generate insight
Because trips with e-scooters can occur from virtually any position (consider for example the noise in position from GNSS devices), data need to be aggregated to be analysed and understood. By clustering or grouping nearby positions from the start and end points of rides, we gain an understanding of popular locations in a city. Moreover, the clusters allow us to build statistics on different localities in a city. Where do people go for lunch? Are there commuter paths? What activities deviate from normality? Data clustering is an example of unsupervised machine learning, an invaluable tool in data science.
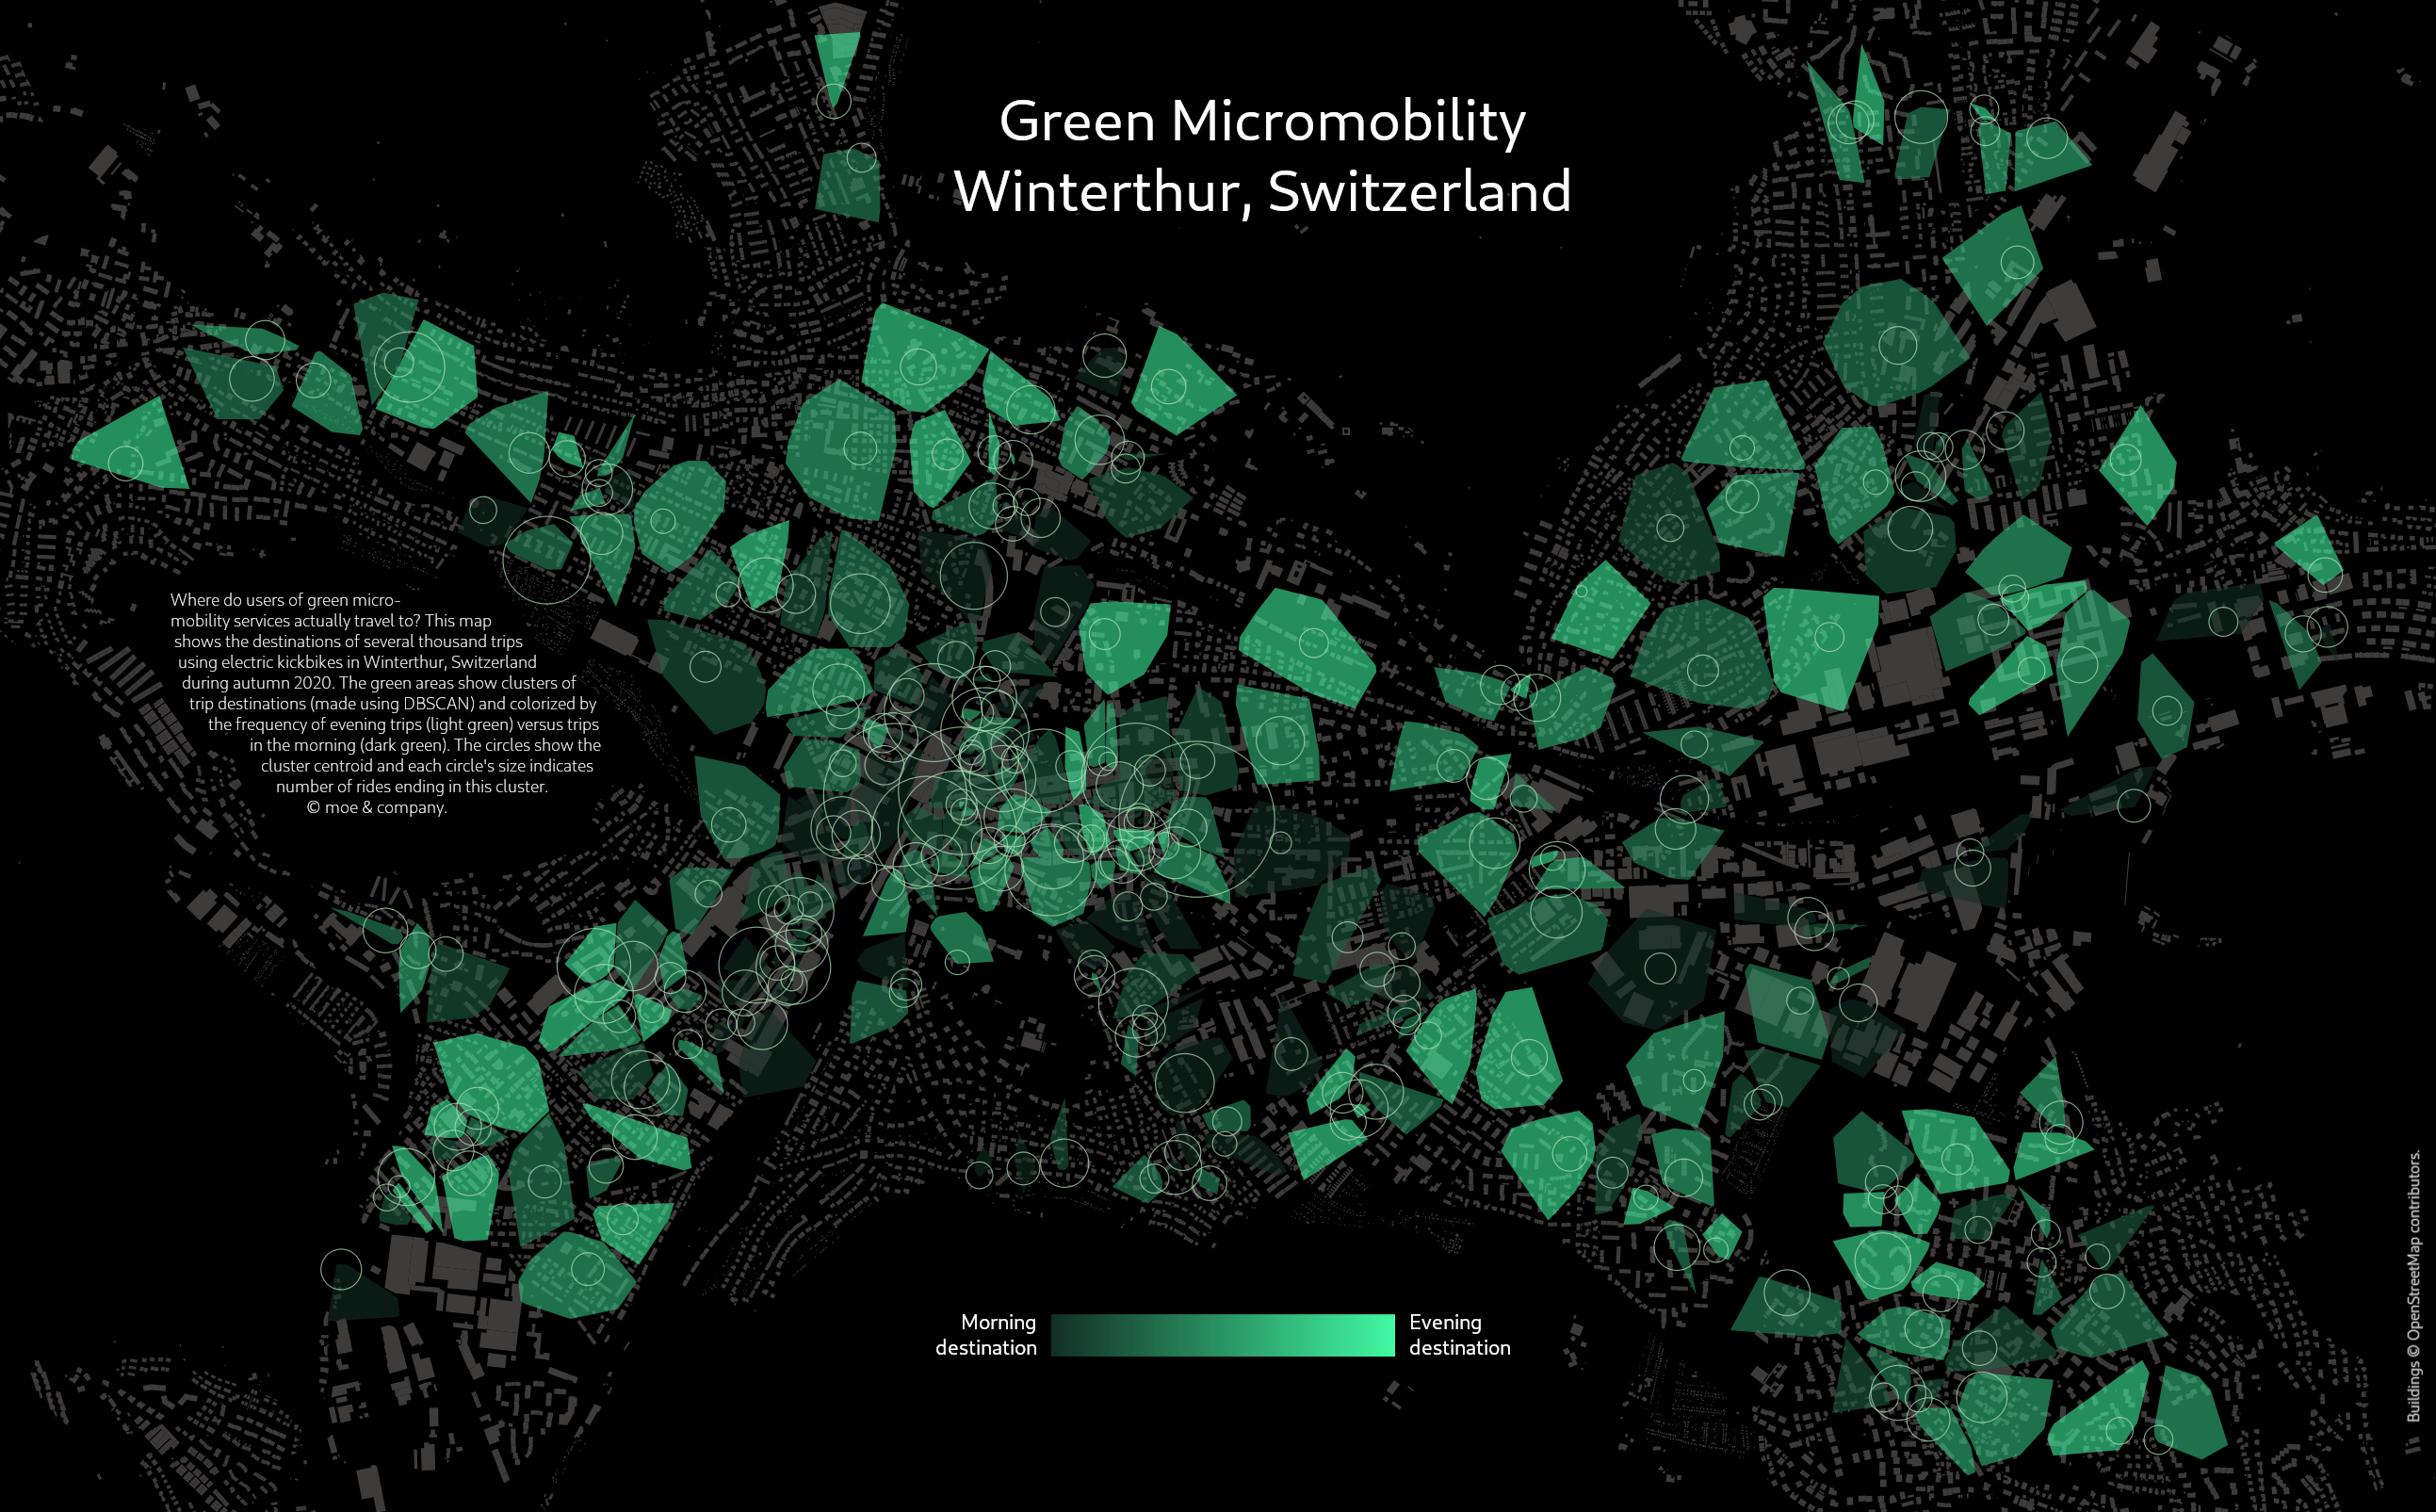
There are plenty of facts and attributes that can be calculated for each cluster. In the image above we visualize the time of day a cluster is typically visited using colour intensity and use the circle size to represent the frequency of visits for various clusters. We see that some parts of the city are typically visited in the evenings and are likely related to cultural or social activities, whereas other parts are more often visited during the morning or day, likely commutes or trips related to work.
We have also investigated how the kick-bikes can complement public transport, how events in the city can be detected in the behaviour of kick-bike users, and impact on usage from external factors, such as weather. A reliable alternative to public transport needs to be attractive in heavy rain as well.
Summary
There are a lot of insights to be gained from micromobility data and patterns, in this article we have only scratched the surface. In upcoming articles we will look at a few of the aspects mentioned in this article in more detail, such as policy options and implications and deriving insights into behaviour based on aggregated transport patterns.
At moe & company we help our clients collect, prepare, process and analyse data in order to understand the status quo, evaluate impact, generate ideas and build a sound basis for making decisions. If you want to know how we can help you, don’t hesitate to contact us already today!