In an increasingly data-driven world, the ability to predict future developments plays a crucial role in a company’s success. Whether in logistics, sales, or workforce planning, forecasting is an essential tool that helps make informed decisions based on historical data.
Using a new tool often causes discomfort and scepticism. This article aims to alleviate that discomfort by explaining the fundamentals of forecasting by using non-sensitive e-scooter data from Winterthur, where our company headquarters is located, and highlighting the opportunities it offers.
Why is forecasting important?
Forecasting is the art of identifying patterns through past data analysis and making reliable predictions for the future. For companies of all sizes, it means reducing uncertainty and being better prepared for upcoming developments. Whether predicting sales, inventory, or staffing needs, well-founded forecasting enables more efficient resource planning and avoids overcapacity or costly bottlenecks. Forecasting also makes it possible to act proactively and adapt quickly to market changes.
E-Scooter Data as an Example: How Does Forecasting Work in Practice?
To understand the fundamentals of forecasting, let’s look at an example from the world of e-scooter rentals. Suppose you operate an e-scooter rental service across Winterthur and want to understand when and where demand for the scooters is highest. You have collected data on the rentals and returns of the scooters, but what now? How can this information be used to identify future trends? Is it advisable to relocate or expand the fleet of e-scooters?
1. Data Collection and Analysis
A thorough analysis of the available data forms the basis for any successful forecast. In our case, we examine the use of e-scooters in Winterthur. This includes a comprehensive collection of data on the scooters’ locations and usage times throughout the city. The first step is to systematically examine the data and formulate a precise question, such as: “At what times are how many e-scooters available near Winterthur station?”
To create reliable predictions for specific areas – like Winterthur station – we use machine learning (ML) to identify geographic clusters. The data is then processed according to these clusters to identify patterns and optimize predictions accordingly.
2. Creating and Reviewing Time Series
A key aspect of quantitative forecasting is creating a time series, which summarizes the e-scooter usage on a daily or hourly basis to analyse the temporal distribution of usage. Aggregating the data by hour gives us initial insights into usage patterns, which we can use for our forecasts.

Before proceeding with the actual forecast, we need to critically examine the data. Are there enough data points to make reliable predictions? Are the data complete, or are there gaps due to technical issues? Missing data can be supplemented using historical comparisons or synthetic data, or we can use models that can handle missing values (e.g. Prophet).
3. Model Selection and Validation
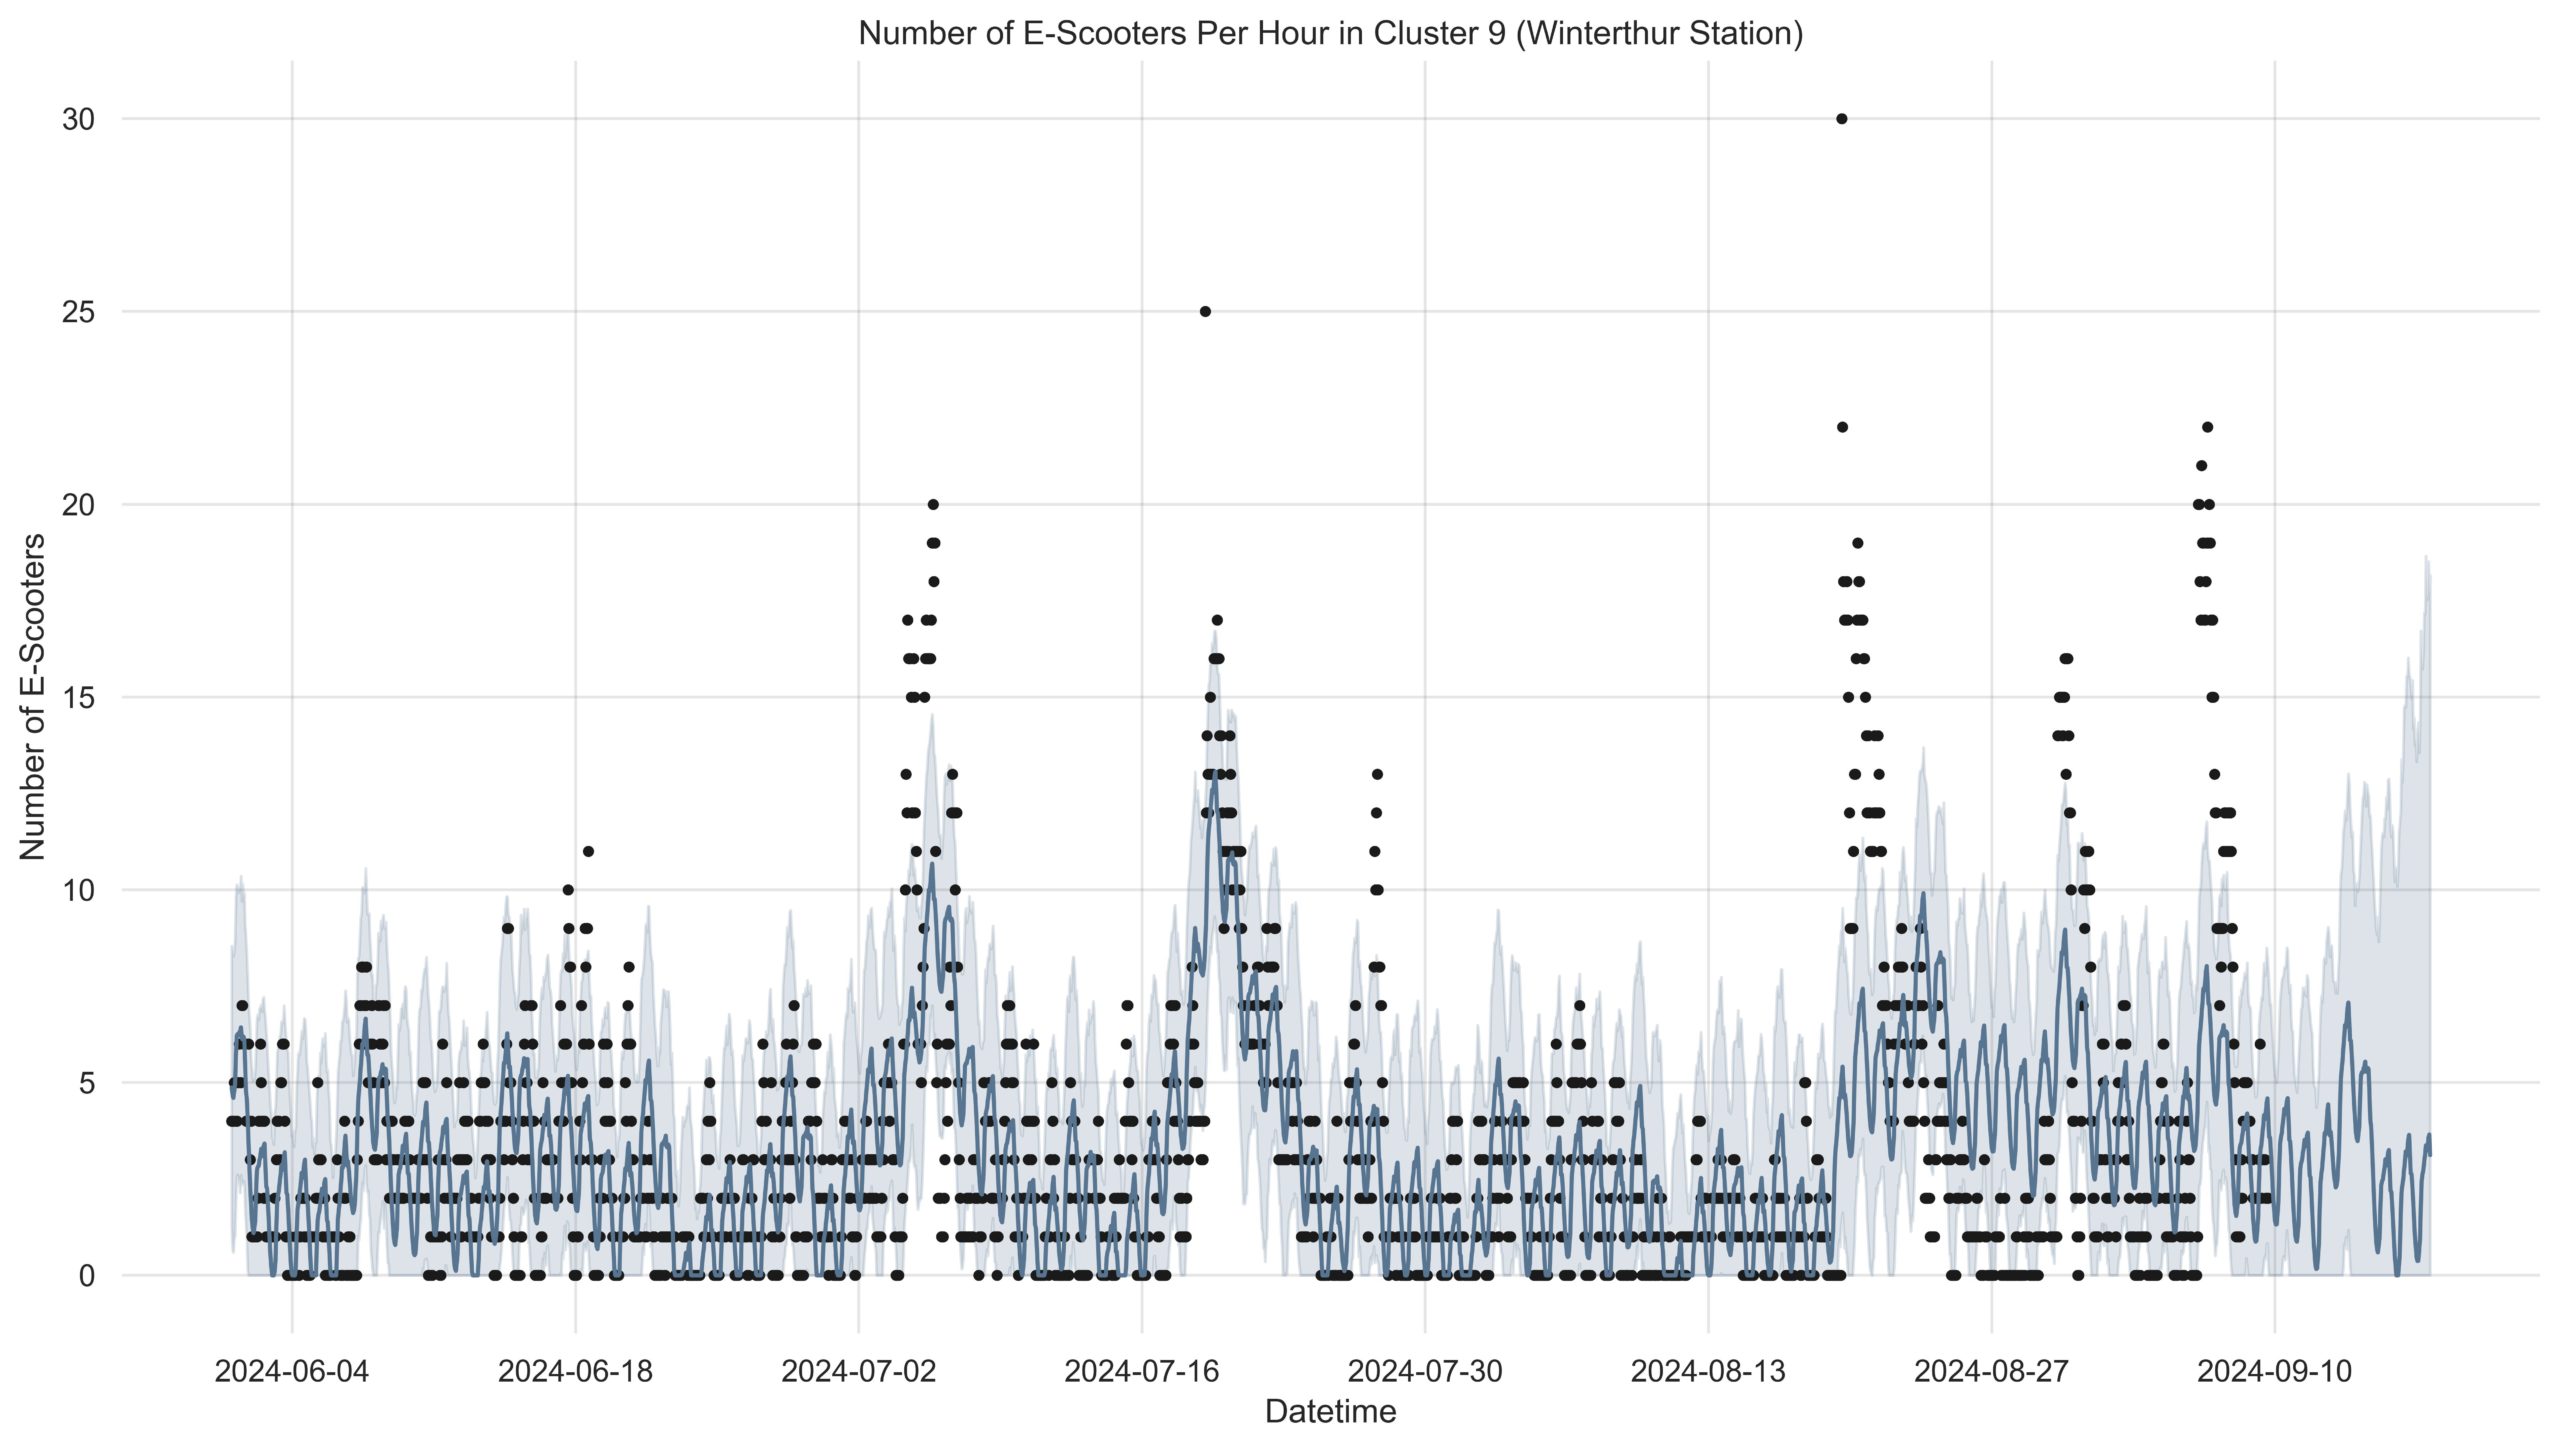
Based on the analysed data, an appropriate forecasting model is selected. The choice of model depends on the data’s granularity and structure. In addition, relevant external factors, such as school holidays or weather, are included in the modelling. To evaluate the model’s quality, part of the data is reserved for validation. This validation process allows the model to be adjusted and ensures it is applicable to future data. In the graph, we see the historical data represented by black dots, while the grey line reflects the forecast generated by our model. Overfitting – where the model becomes too tailored to the training data – must be avoided.

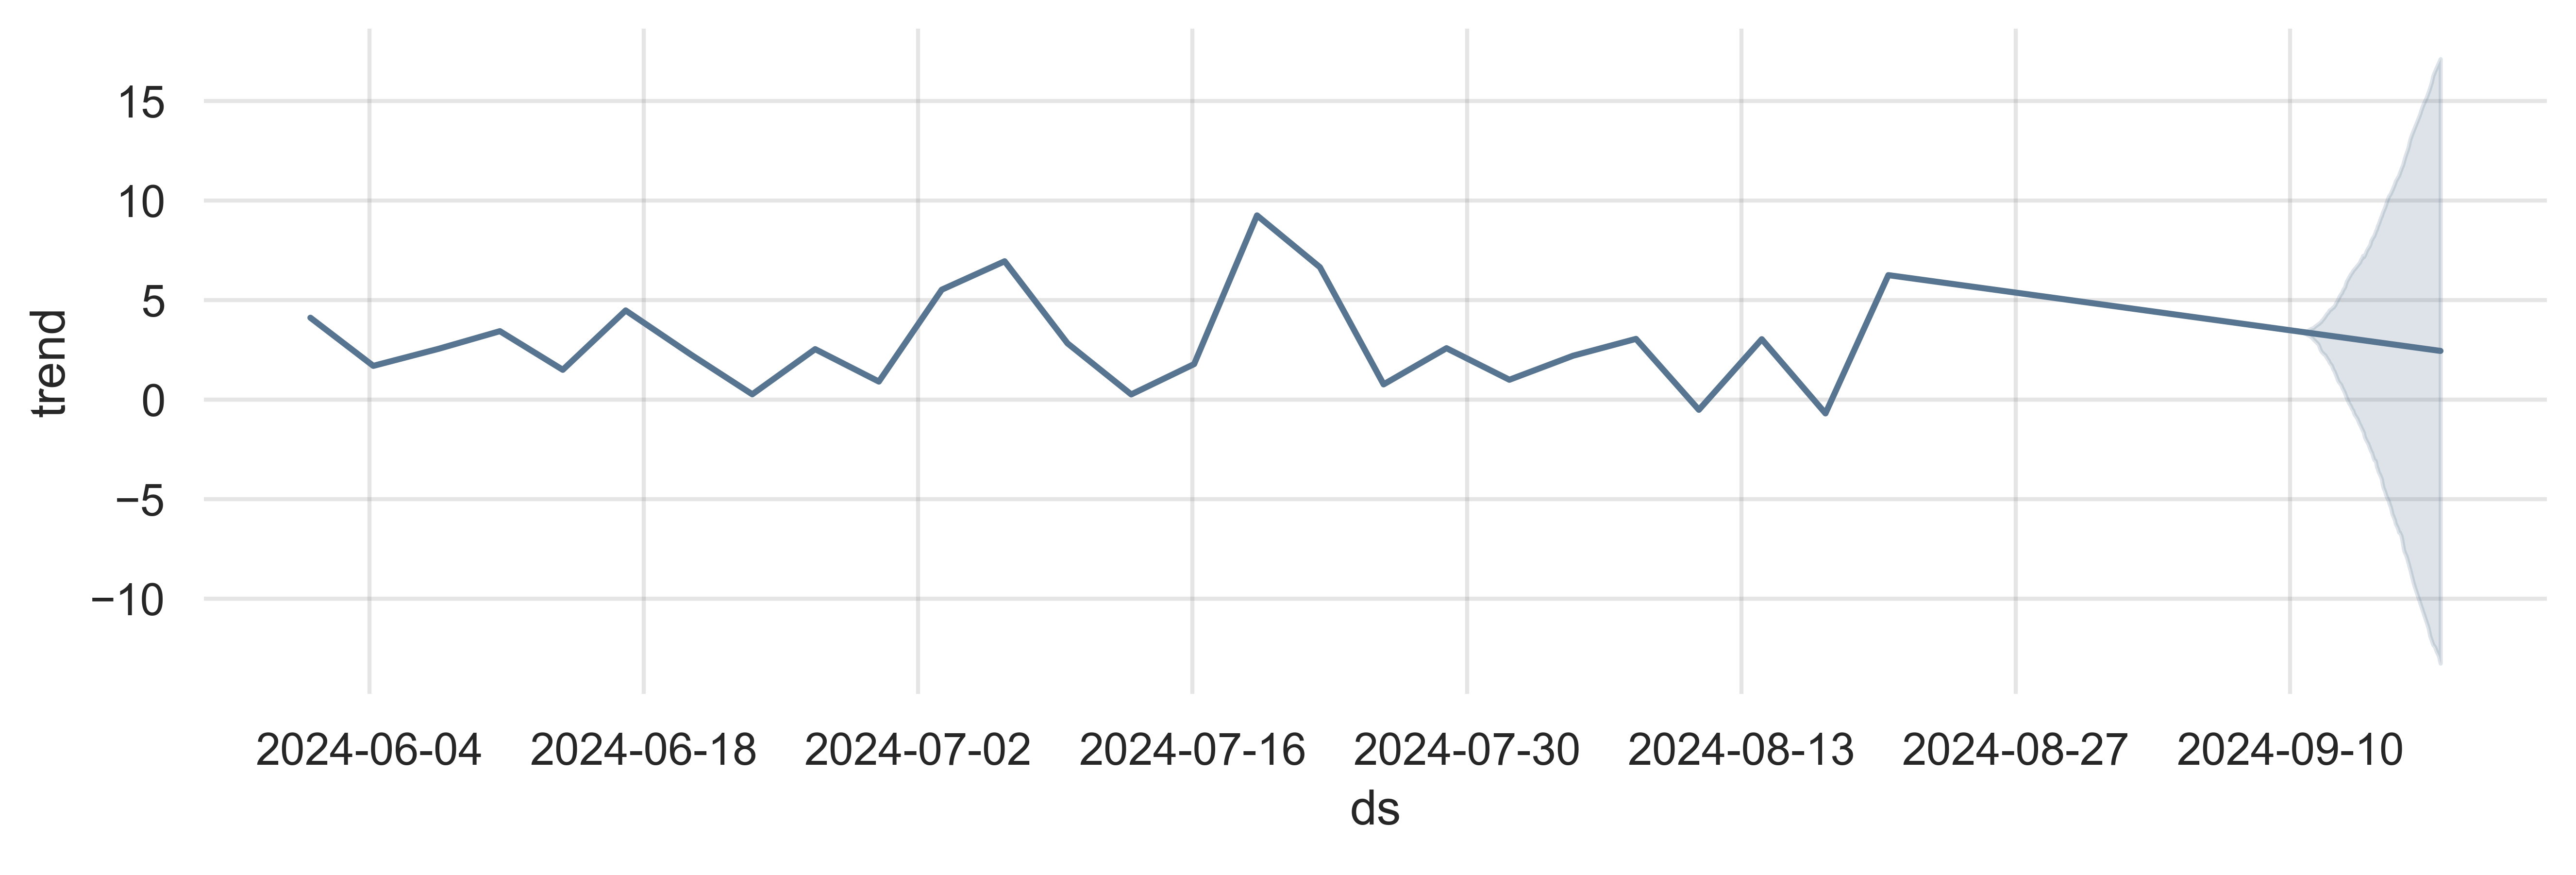
The Prophet model used in the e-scooter example for Winterthur identifies seasonal trends and patterns, and it separates them from the overall trend. The final forecast is the result of combining these two parts – the overall trend and seasonal patterns – through addition.
Forecast components:
Trend Component:
-
- This reflects the long-term, baseline number of scooters available at Winterthur station. It is independent of any short-term fluctuations or cyclical behavior.
- The trend component moves relatively slowly over time and captures the overall growth or decline in e-scooter availability.

Seasonal Components:
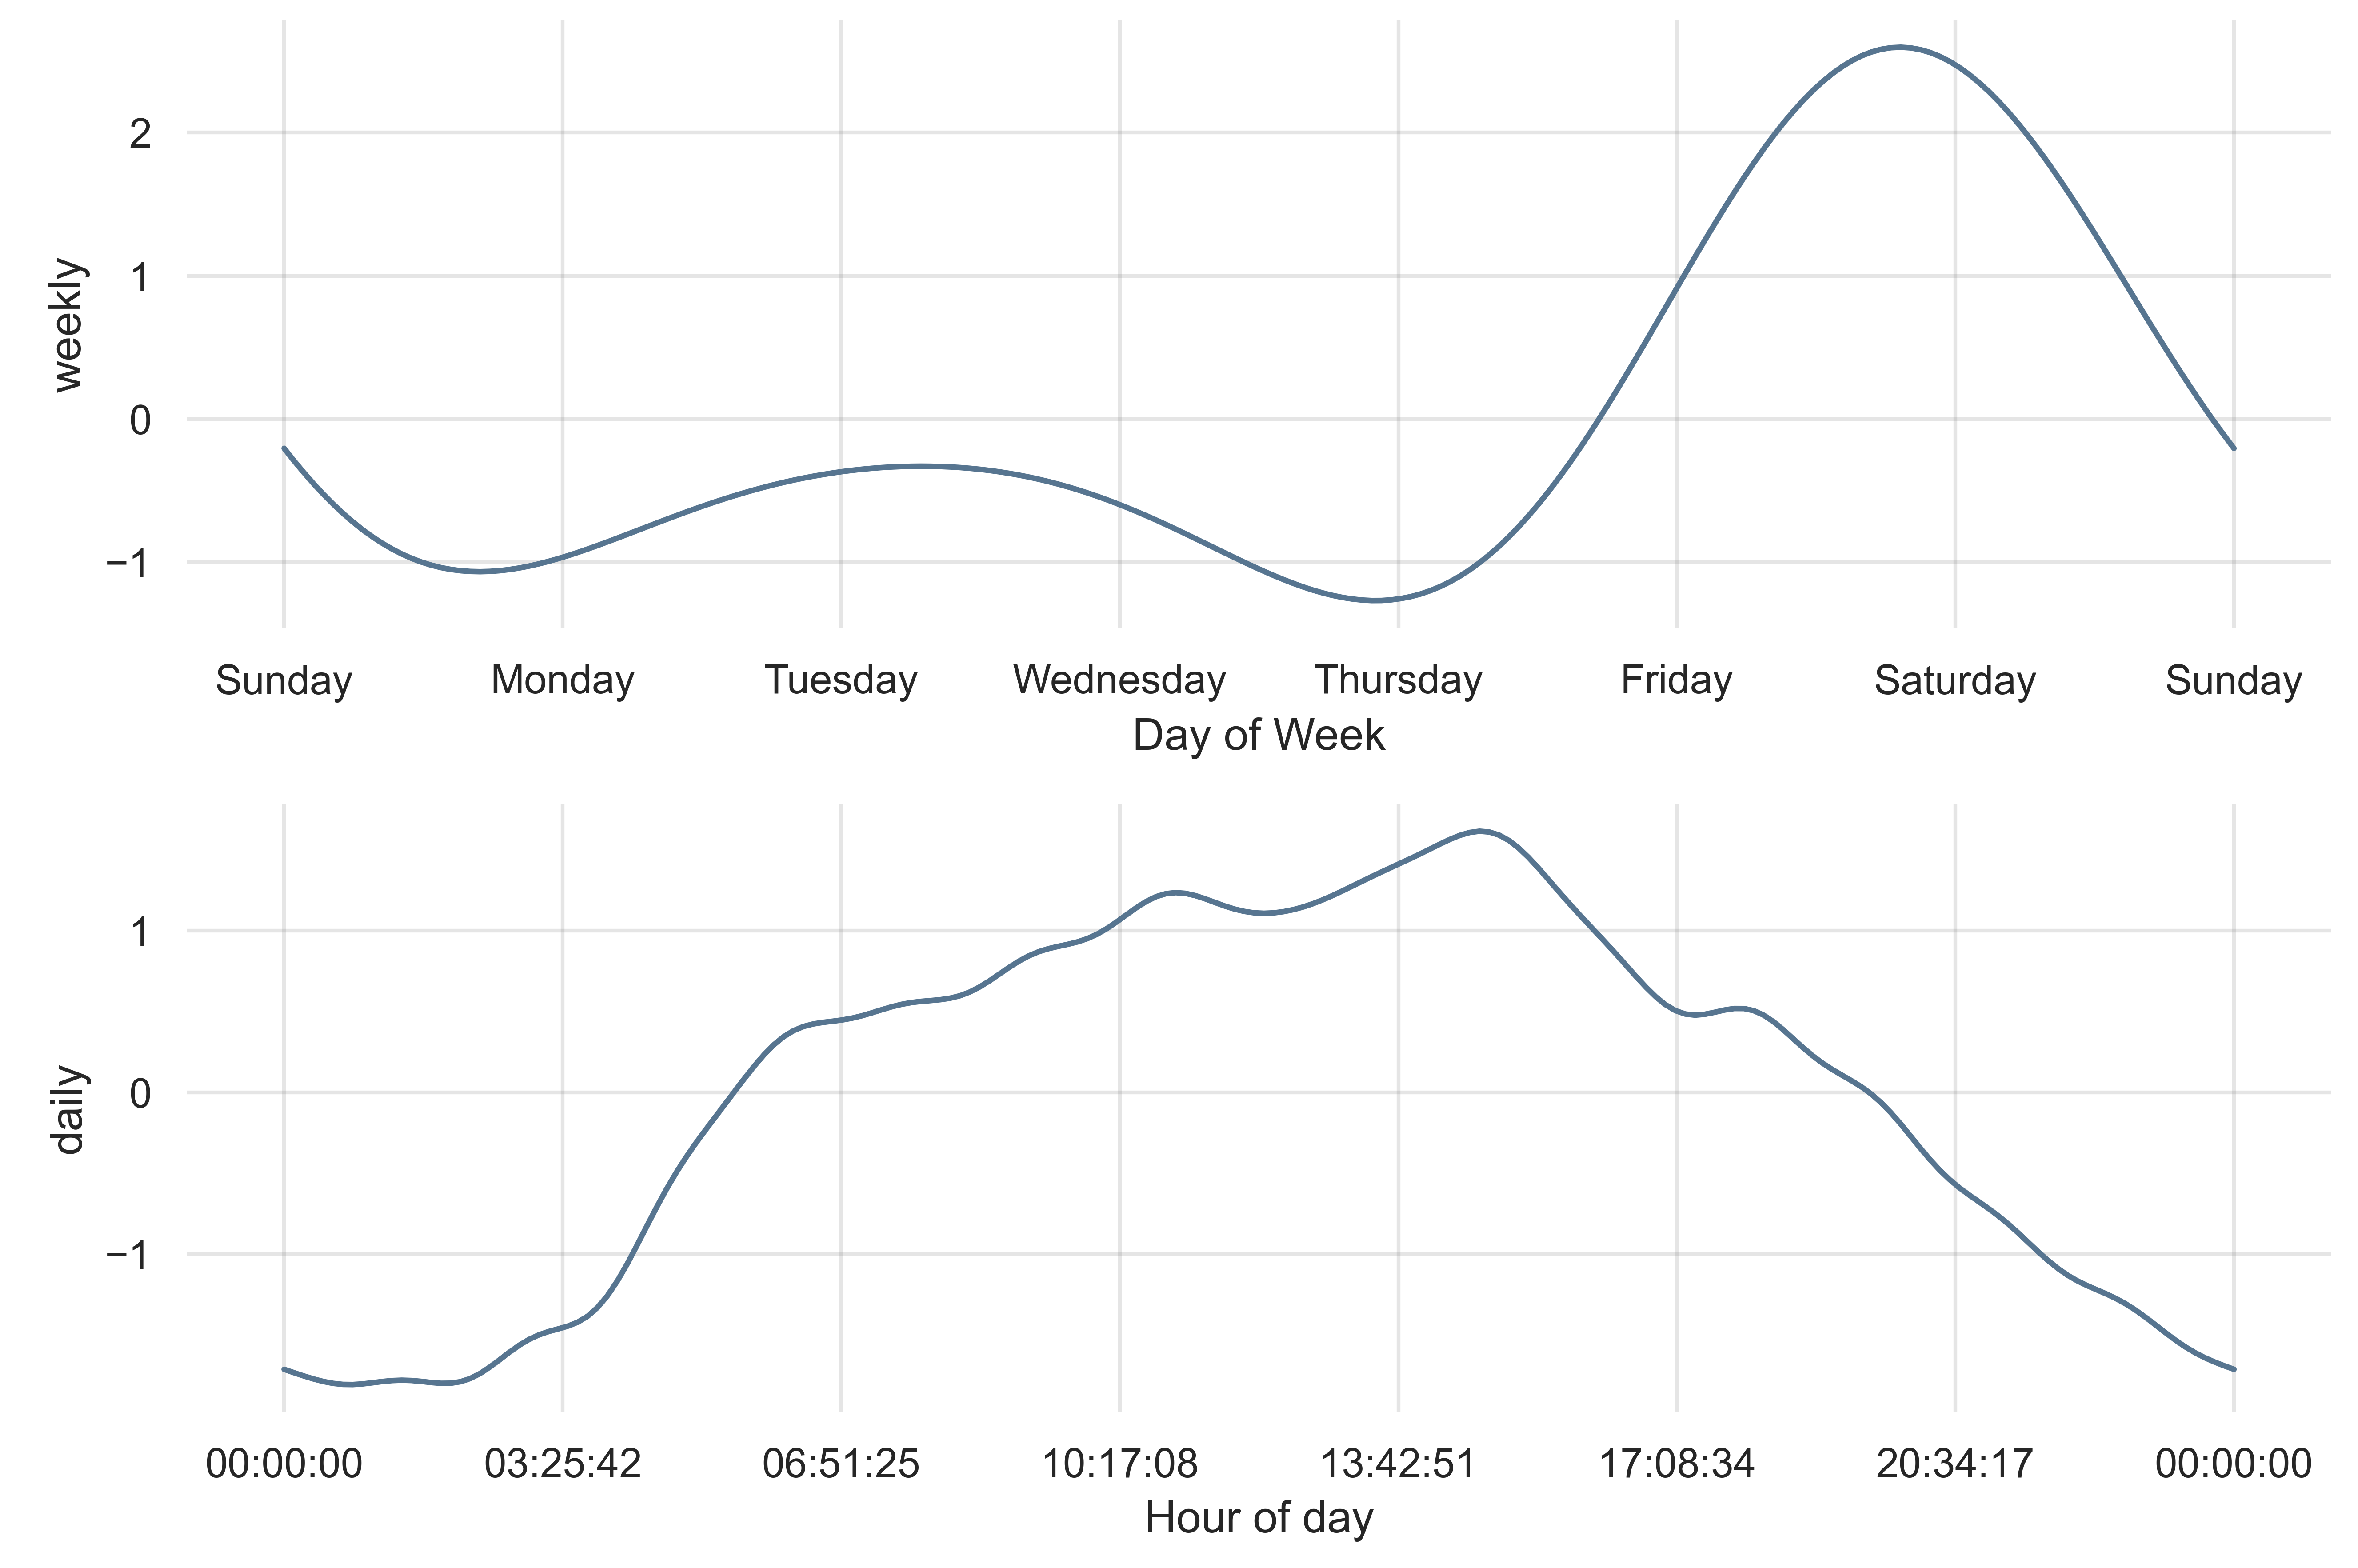
Values above 0 in the seasonality graphs indicate an above-average number of scooters available at the station. Values below 0 represent a below-average number of scooters.
-
- Daily Seasonality: This accounts for how the number of available scooters fluctuates throughout the day. For example, the number of scooters is higher during peak commuter times (6 a.m. to 5 p.m.) and lower during late night or early morning hours.
- Weekly Seasonality: This represents recurring patterns across the week. For instance, on weekends, scooter availability is generally above average as people use e-scooters more for leisure activities.

4. Using the Forecast to Optimize Supply
Based on the predictions, targeted actions can be taken to better align supply with demand. In the case of e-scooters, this means increasing availability in the evenings, as availability declines significantly in the afternoon. These precise forecasts ensure optimal resource utilization and improve customer satisfaction.
Forecasting Methods for Businesses
The above example provides only a glimpse into the possibilities of forecasting. In practice, businesses use different methods depending on their industry and application to predict future developments. Here are some of the most common methods:
Time Series Analysis: Models like ARIMA, SARIMAX, or Prophet use historical data to predict future trends. By incorporating external factors such as weather conditions, they can provide even more accurate forecasts.
Causal Models: Analyse cause-and-effect relationships. A regression analysis can show how external factors such as weather or holidays affect e-scooter usage. Extended time series models can also capture these causal relationships.
Machine Learning: Algorithms such as neural networks or random forests analyse large and complex datasets. They are especially valuable in data-intensive areas, as they consider historical data and external factors and capture complex patterns.
How Do Businesses Benefit from Forecasting?
The benefits of forecasting are diverse and extend far beyond just predicting trends. Companies that use forecasting tools can achieve significant efficiency gains and cost savings in various areas:
- Optimized Resource Allocation: Accurate forecasts ensure optimal use of personnel and resources – such as having enough scooters available during peak times.
- Better Decision Making: Well-founded data supports realistic goal setting and strategic investments.
- Risk Management: Early risk detection allows for quick adaptation to market changes.
- Customer Satisfaction: Accurate forecasting increases availability and reduces inventory costs.
How Trustworthy is Forecasting?
A common objection to predictive models is their reliability. Many prefer to rely on their years of experience. So, what’s the advantage of forecasting? It uses large amounts of data to make objective, data-based assessments. Unlike human decisions, which are often influenced by emotions or biases, predictive models are neutral and fact-based.
Moreover, predictive models are constantly updated with new data, allowing them to adapt to changing conditions. The models become more precise as they learn, providing helpful forecasts even in unexpected developments.
Conclusion
Forecasting is a powerful tool that helps businesses cope with the uncertainties of the future. Using e-scooter data, we’ve demonstrated how simple, yet meaningful predictions can be made. But the possibilities go far beyond this. Whether in insurance, workforce planning, sales, or inventory management, companies that use data-driven forecasting can increase their efficiency and make well-informed decisions.
The future cannot be predicted, but with forecasting, we can get a little closer to it.

Author : Maria Ilaria Anania
Data Science Consultant
Maria Ilaria Anania is a Data Scientist with a background in chemistry and biology, focusing on forecasting and data analysis as her core strengths.